Building for a Distribution Business Series: #3 The Database
Building for a Distribution Business Series: #3 The Database
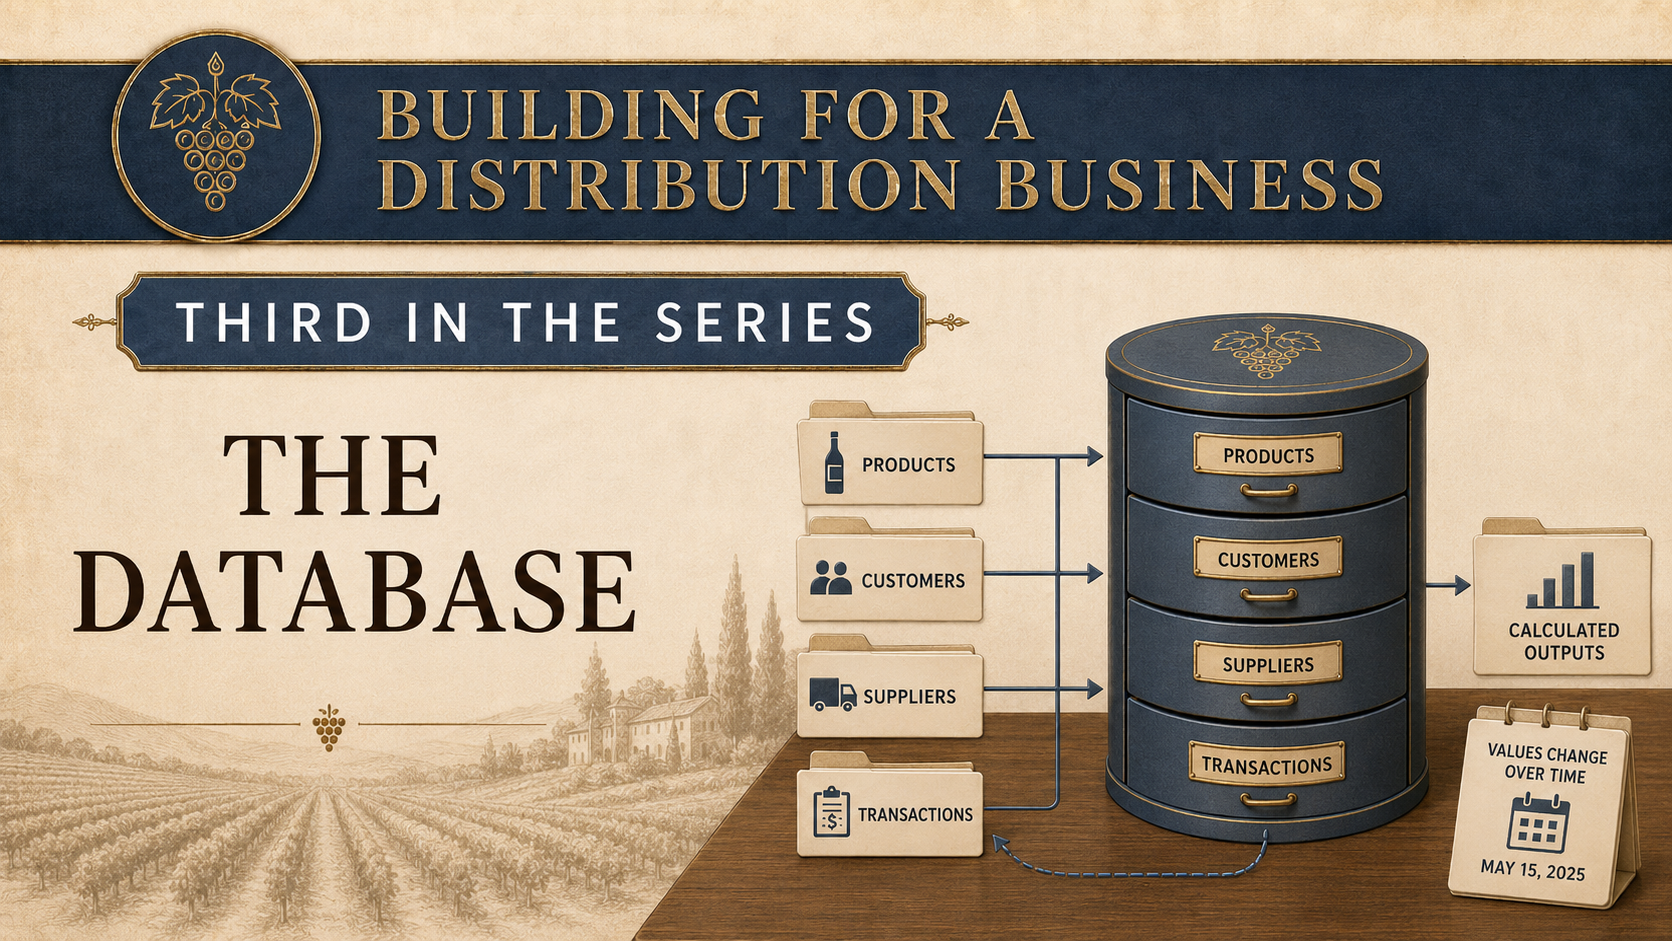
The article explains how a distribution business can structure its database so that products, customers, suppliers, transactions, changing values, and calculated outputs remain distinct but connected. It provides a practical mental model for data design: store what happened and where each figure came from, keep changing values dated, and treat anything that can be reconstructed as derived rather than original data. It supports the project by showing how the database structure determines which operational, commercial, and customer-level questions the later system can answer.
The article explains how a distribution business can structure its database so that products, customers, suppliers, transactions, changing values, and calculated outputs remain distinct but connected. It provides a practical mental model for data design: store what happened and where each figure came from, keep changing values dated, and treat anything that can be reconstructed as derived rather than original data. It supports the project by showing how the database structure determines which operational, commercial, and customer-level questions the later system can answer.
- Status
- Building
- Started
- July 2026
Audio Overview
ENThe Database: A Typical Data Composition for a Distribution Business
The third in a series about a system built for a distribution business. The first set out the approach, working back from the customer experience to establish what a business has to know in order to deliver it. The second covered the checks applied to every source file before a figure is accepted from it. This piece describes what those figures are loaded into.
The structure matters more than it appears to. It determines which questions can be asked of the data, and it is the most expensive component to change once anything has been built above it.
What follows is the composition in five groups: the entities the business refers to, the values attached to them that change over time, the events it records, the provenance of each figure, and the outputs calculated from all of it. The rule that separates them is that anything which can be reconstructed from what is already recorded belongs in the last group and not in the others. A closing section sets out what the composition makes possible.
Master data: the entities the business refers to
Records that change infrequently. Every transaction and every calculation refers back to them.
Product. The master record, keyed on the business's own product code. It holds what the item is, its type, country and region, the dates it was first and last seen in a source file, and a link to each of the three parties described below: the producer, the supplier and the sourcing partner.
Packaging. Case size, unit volume, weight and pallet configuration for each product. Quantities are worked out in single units, while purchasing is transacted in cases and shipped on pallets. This record is what allows one to be converted into the other.
Producer. The party that made the item: name, country, typical delivery time, minimum order quantity, and whether mixed pallets are accepted.
Supplier. The party with whom the order is placed, which may differ from the producer.
Sourcing partner. The agency through which the item is imported, held once rather than repeated against every product it supplies.
Customer. Each account, its business type, and the sales channel through which it purchases.
Rated values: what a product costs and what it sells for
Both change over time and both are therefore dated, which is what separates them from the master records above. A figure quoted without the date it applied from is not usable in any calculation that looks backwards.
Cost. The landed cost of each product, recorded per delivery because it varies between deliveries: purchase price together with freight, duty and clearance. For an importer this is a build-up rather than a single figure, and it is what every question about profitability rests on.
Price. The selling price of each product by channel, with the dates it applied from, and any discount applied against it.
Transactional data: the record of what occurred
Dated events. Each row states that something happened on a specific date, and collectively they form the evidence base for every calculation the system performs.
Customer transactions. One row per line of business: the account, the product, the quantity, the price and the date. This is the record that connects the customer to everything else. Without it, no customer-level question can be answered.
Monthly sales. One row per product per completed month, holding two quantities. The first is reported by sales files and split by sales channel. The second is taken from the stock report covering that month, which is produced later and therefore after adjustments have posted, and is treated as the more settled figure. Each carries the file and date from which it was taken. This is held rather than derived from the transactions above, because the finance system states the month directly and its figure does not always agree with the sum of the lines beneath it. Where the two disagree, the disagreement is itself worth knowing.
Monthly landing. Sales accumulated so far within a month that has not yet closed, read at intervals through the month and dated each time. Where monthly sales records a finished month, this records a month in flight. It is what allows the month's final total, its landing, to be projected before the month ends, and it is held separately so that a part-finished figure is never mistaken for a completed one.
Stock position. One row per product per stock report, recording four layers separately: on hand and available for sale, reserved against orders already taken, held in the bonded warehouse with duty unpaid, and on water, meaning shipped but not yet arrived. The total is not stored, since it is the sum of the four.
Adjustments. Every movement that is not a sale, with its reason recorded: customer return, breakage, sample or event. Negative quantities are legitimate, but a return and a breakage carry different implications for demand, and only one of them is a demand signal.
Unmet demand. Orders that could not be filled and requests that went unanswered. In its absence, demand is inferred from sales alone, which understates demand for any product that ran out.
Purchase orders. What has been ordered, from which party, when it is expected, when it arrived, and its current stage.
Events. Promotions, holidays and other factors that shape demand. An entry with no product attached applies across the catalogue.
Audit and lineage: the provenance of every figure
Not presented to the business. This group is what allows any figure on any report to be traced back to the file that supplied it.
Load record. One row per file per run: what was received, what was determined about it, and where the full report is held.
Deletion record. Every automatic deletion, together with the policy that authorised it.
Revision record. Every instance in which a later file restated a figure: the previous value, the new value, and both source files.
Derived data: the outputs the system calculates
Nothing in this group is original. It could be deleted in its entirety and reconstructed from the records above, using the settings under which each calculation was run.
Each time a calculation runs, the system records the run itself: when it took place, the settings it was given, and the period it was calculated as of. It then records one result per product, and each result carries the input values from which it was derived.
Results are never overwritten. A figure produced this month can therefore be set against the one produced last month, and the difference attributed either to a change in the underlying data or to a change in the settings applied.
What the composition makes possible
Stock levels matched to demand, in both directions. Order quantities can be worked out per product from its own demand history and set against what is already on hand, allocated, held and in transit. A product selling steadily is treated differently from one selling twice a year. The same calculation works in reverse: products that do not justify an order are not ordered, and stock held back is not released until demand supports it. With cost recorded, the capital committed to stock is a measured figure rather than an estimate.
Ranking by contribution rather than volume. Cost and price together give margin per product. The highest-selling product and the most profitable one are rarely the same, and a business able to see only volume will continue to invest against the wrong half of its catalogue.
Discounting as a decision rather than a convention. With price, discount and margin held against each transaction, the effect of a given discount can be measured, and the level that would have been sufficient can be established.
Purchasing at defensible economics. With supplier, producer, packaging and minimum order quantity recorded, small requirements across several products can be combined into a single order that fills a pallet or meets a minimum. Each supplier's own delivery time is applied, rather than a single figure standing for all of them.
Visibility of the month before it closes. Weekly readings are held separately from completed months and each carries the date it was taken, so a month in progress can be assessed while it is still running. Products moving materially away from their usual pattern are identified partway through rather than after it has ended.
Demand undistorted by season, promotion or return. Sales are held by product and by month, so a seasonal pattern remains visible rather than being averaged away across the year. Events are recorded, so a promotion is not read as a change in underlying demand. Adjustments carry reasons, so breakage is not read as a customer decision. Unfilled orders are counted, so a product that ran out is not read as a product without demand.
Offers derived from actual purchasing behaviour. With customer transactions recorded, the products an account is likely to want can be identified, a substitute can be offered when the usual choice is unavailable, and an offer can be directed to accounts with a history of purchasing that category rather than distributed to the entire list.
Recommendations that can be interrogated. Every calculation stores the settings applied and the inputs behind each result. Where a figure differs from the previous month's, the reason can be demonstrated rather than asserted.
What the composition does not settle
A composition of this kind establishes what can be recorded and what can be asked. It does not make the recorded figures correct, which is the work of the checks described in the previous piece. Nor does it resolve the commercial questions underneath it: what counts as a distinct product, which accounts belong to which channel, and what a business considers a season are decisions the business must make, and the structure only holds the answers.
Creating a table before the data exists to fill it is an informed guess about which questions will matter later. Carrying an unused table costs almost nothing, so the guess is cheap to make, but it can still turn out to be the wrong one.
This piece has set out what is recorded about each calculation and what is kept alongside its results, but not what any of those calculations does. The logic itself, and the dashboard through which its results reach the people who act on them, are the subject of the next piece.
The Database: A Typical Data Composition for a Distribution Business
The third in a series about a system built for a distribution business. The first set out the approach, working back from the customer experience to establish what a business has to know in order to deliver it. The second covered the checks applied to every source file before a figure is accepted from it. This piece describes what those figures are loaded into.
The structure matters more than it appears to. It determines which questions can be asked of the data, and it is the most expensive component to change once anything has been built above it.
What follows is the composition in five groups: the entities the business refers to, the values attached to them that change over time, the events it records, the provenance of each figure, and the outputs calculated from all of it. The rule that separates them is that anything which can be reconstructed from what is already recorded belongs in the last group and not in the others. A closing section sets out what the composition makes possible.
Master data: the entities the business refers to
Records that change infrequently. Every transaction and every calculation refers back to them.
Product. The master record, keyed on the business's own product code. It holds what the item is, its type, country and region, the dates it was first and last seen in a source file, and a link to each of the three parties described below: the producer, the supplier and the sourcing partner.
Packaging. Case size, unit volume, weight and pallet configuration for each product. Quantities are worked out in single units, while purchasing is transacted in cases and shipped on pallets. This record is what allows one to be converted into the other.
Producer. The party that made the item: name, country, typical delivery time, minimum order quantity, and whether mixed pallets are accepted.
Supplier. The party with whom the order is placed, which may differ from the producer.
Sourcing partner. The agency through which the item is imported, held once rather than repeated against every product it supplies.
Customer. Each account, its business type, and the sales channel through which it purchases.
Rated values: what a product costs and what it sells for
Both change over time and both are therefore dated, which is what separates them from the master records above. A figure quoted without the date it applied from is not usable in any calculation that looks backwards.
Cost. The landed cost of each product, recorded per delivery because it varies between deliveries: purchase price together with freight, duty and clearance. For an importer this is a build-up rather than a single figure, and it is what every question about profitability rests on.
Price. The selling price of each product by channel, with the dates it applied from, and any discount applied against it.
Transactional data: the record of what occurred
Dated events. Each row states that something happened on a specific date, and collectively they form the evidence base for every calculation the system performs.
Customer transactions. One row per line of business: the account, the product, the quantity, the price and the date. This is the record that connects the customer to everything else. Without it, no customer-level question can be answered.
Monthly sales. One row per product per completed month, holding two quantities. The first is reported by sales files and split by sales channel. The second is taken from the stock report covering that month, which is produced later and therefore after adjustments have posted, and is treated as the more settled figure. Each carries the file and date from which it was taken. This is held rather than derived from the transactions above, because the finance system states the month directly and its figure does not always agree with the sum of the lines beneath it. Where the two disagree, the disagreement is itself worth knowing.
Monthly landing. Sales accumulated so far within a month that has not yet closed, read at intervals through the month and dated each time. Where monthly sales records a finished month, this records a month in flight. It is what allows the month's final total, its landing, to be projected before the month ends, and it is held separately so that a part-finished figure is never mistaken for a completed one.
Stock position. One row per product per stock report, recording four layers separately: on hand and available for sale, reserved against orders already taken, held in the bonded warehouse with duty unpaid, and on water, meaning shipped but not yet arrived. The total is not stored, since it is the sum of the four.
Adjustments. Every movement that is not a sale, with its reason recorded: customer return, breakage, sample or event. Negative quantities are legitimate, but a return and a breakage carry different implications for demand, and only one of them is a demand signal.
Unmet demand. Orders that could not be filled and requests that went unanswered. In its absence, demand is inferred from sales alone, which understates demand for any product that ran out.
Purchase orders. What has been ordered, from which party, when it is expected, when it arrived, and its current stage.
Events. Promotions, holidays and other factors that shape demand. An entry with no product attached applies across the catalogue.
Audit and lineage: the provenance of every figure
Not presented to the business. This group is what allows any figure on any report to be traced back to the file that supplied it.
Load record. One row per file per run: what was received, what was determined about it, and where the full report is held.
Deletion record. Every automatic deletion, together with the policy that authorised it.
Revision record. Every instance in which a later file restated a figure: the previous value, the new value, and both source files.
Derived data: the outputs the system calculates
Nothing in this group is original. It could be deleted in its entirety and reconstructed from the records above, using the settings under which each calculation was run.
Each time a calculation runs, the system records the run itself: when it took place, the settings it was given, and the period it was calculated as of. It then records one result per product, and each result carries the input values from which it was derived.
Results are never overwritten. A figure produced this month can therefore be set against the one produced last month, and the difference attributed either to a change in the underlying data or to a change in the settings applied.
What the composition makes possible
Stock levels matched to demand, in both directions. Order quantities can be worked out per product from its own demand history and set against what is already on hand, allocated, held and in transit. A product selling steadily is treated differently from one selling twice a year. The same calculation works in reverse: products that do not justify an order are not ordered, and stock held back is not released until demand supports it. With cost recorded, the capital committed to stock is a measured figure rather than an estimate.
Ranking by contribution rather than volume. Cost and price together give margin per product. The highest-selling product and the most profitable one are rarely the same, and a business able to see only volume will continue to invest against the wrong half of its catalogue.
Discounting as a decision rather than a convention. With price, discount and margin held against each transaction, the effect of a given discount can be measured, and the level that would have been sufficient can be established.
Purchasing at defensible economics. With supplier, producer, packaging and minimum order quantity recorded, small requirements across several products can be combined into a single order that fills a pallet or meets a minimum. Each supplier's own delivery time is applied, rather than a single figure standing for all of them.
Visibility of the month before it closes. Weekly readings are held separately from completed months and each carries the date it was taken, so a month in progress can be assessed while it is still running. Products moving materially away from their usual pattern are identified partway through rather than after it has ended.
Demand undistorted by season, promotion or return. Sales are held by product and by month, so a seasonal pattern remains visible rather than being averaged away across the year. Events are recorded, so a promotion is not read as a change in underlying demand. Adjustments carry reasons, so breakage is not read as a customer decision. Unfilled orders are counted, so a product that ran out is not read as a product without demand.
Offers derived from actual purchasing behaviour. With customer transactions recorded, the products an account is likely to want can be identified, a substitute can be offered when the usual choice is unavailable, and an offer can be directed to accounts with a history of purchasing that category rather than distributed to the entire list.
Recommendations that can be interrogated. Every calculation stores the settings applied and the inputs behind each result. Where a figure differs from the previous month's, the reason can be demonstrated rather than asserted.
What the composition does not settle
A composition of this kind establishes what can be recorded and what can be asked. It does not make the recorded figures correct, which is the work of the checks described in the previous piece. Nor does it resolve the commercial questions underneath it: what counts as a distinct product, which accounts belong to which channel, and what a business considers a season are decisions the business must make, and the structure only holds the answers.
Creating a table before the data exists to fill it is an informed guess about which questions will matter later. Carrying an unused table costs almost nothing, so the guess is cheap to make, but it can still turn out to be the wrong one.
This piece has set out what is recorded about each calculation and what is kept alongside its results, but not what any of those calculations does. The logic itself, and the dashboard through which its results reach the people who act on them, are the subject of the next piece.